Operations · Interconnected data system
MiagaRose
The whole business, modeled in interconnected tables. No new software, no monthly fee.
- Client
- MiagaRose
- Sector
- Independent lifestyle brand
- Market
- Spain · Online + wholesale
- Role
- Operations systems & analytics
- Timeline
- 2025
- Scope
- Data model · Inventory · Costing · Cash flow · Dashboards
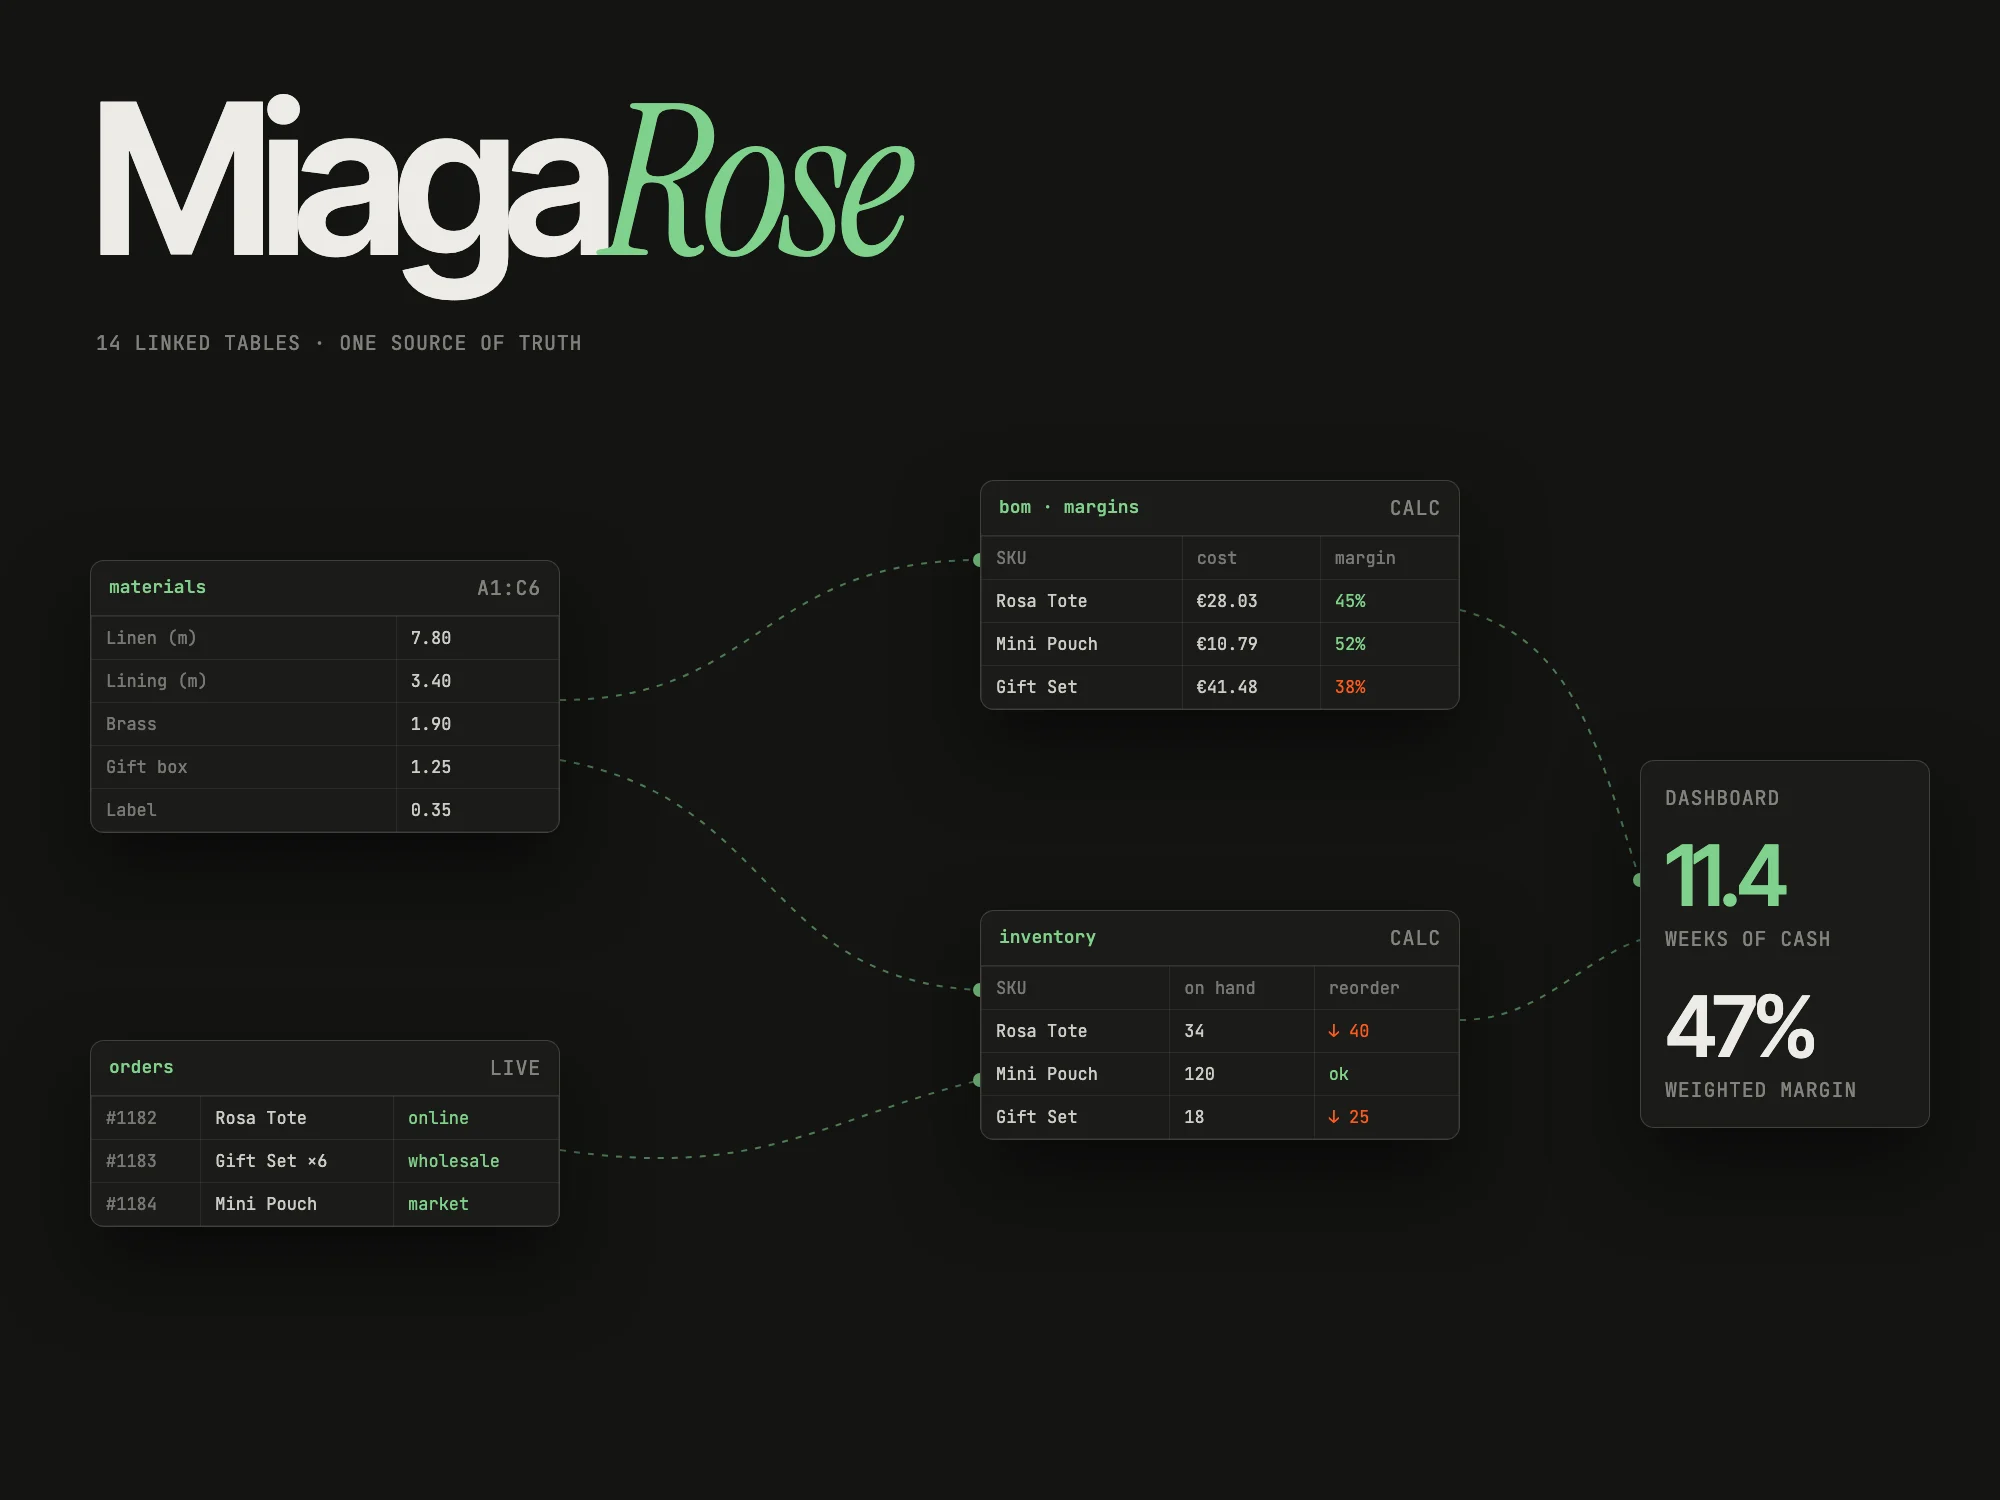
MiagaRose needed control, not another subscription. Stock lived in one file, costs in another, orders in an inbox and cash in the owner’s head. I designed a system of interconnected tables where every sale updates stock, margins and cash, in one place everyone already knew how to use.
Decisions were made on feel: what to reorder, what to discount, whether wholesale was worth it. Nobody knew the true cost of a product once packaging, shipping and payment fees were added, and month-end took two days of copy-pasting.
Design the data model like a database (entities, keys, relationships) and only then build it in the tool the team already lives in.
Dashboards that answer questions
Not charts for their own sake, but answers. What should I reorder this week? Which products make money after every fee? Is wholesale worth it? How many weeks of cash do we have at the current pace?
- Reorder points from sales velocity and lead time
- Best-sellers ranked by contribution margin, not revenue
- Channel P&L: online vs. wholesale vs. markets
Built to be handed over
Protected ranges, data validation, consistent naming and a one-page manual. The owner runs it alone; I’m only called when the business changes shape.
The system behind the screens
A spreadsheet is an interface too. The owner opens it every day, so it was designed like a product: a visual grammar for cells, names you can read aloud, and tabs ordered the way money moves.
Color
Color means one thing only: what you can touch. Green cells are inputs; everything white is a formula and locked. Red appears only when a check fails.
Typography
Rosa Tote · Gift Set · Mini Pouch
Labels and namesNeutral and legible at 10 pt on a laptop screen.
€28.03 45% 11.4 wk
NumbersTabular figures so columns of money line up digit by digit.
Decisions, and why
-
01
Tabs ordered like the flow of money
WhyMasters → transactions → calculations → outputs: you read left to right.
Instead of
One giant sheet with everything. -
02
Named ranges people can read aloud
Why=unit_cost * stock_on_hand survives a handover; =C4*F9 does not.
Instead of
Cell references only the author understands. -
03
Margins after every fee
WhyRanking by revenue was rewarding the products that lost money.
Instead of
Gross margin on the list price.
Schema
| A · sku | B · unit_cost | C · price | D · margin | E · check | |
|---|---|---|---|---|---|
| 2 | Rosa Tote | 28.03 | 58.00 | =1-(B2/(C2*0.936)) | ✓ |
| 3 | Mini Pouch | 10.79 | 26.00 | 48% | ✓ |
| 4 | Gift Set | 41.48 | 39.00 | −14% | ✕ price < cost |
- Input
- Formula · locked
- Lookup
- Check failed
- Relational data model
- 14 linked tables
- Costing & pricing engine
- Inventory & reorder logic
- Cash-flow forecast
- Owner’s manual
- Sync orders automatically from the online store.
- Move to a lightweight database once volume justifies it.